Permissions
This area requires a Service or Finance license to access.
Users, Super Users, Owners and Internal Users can view the data within this area.
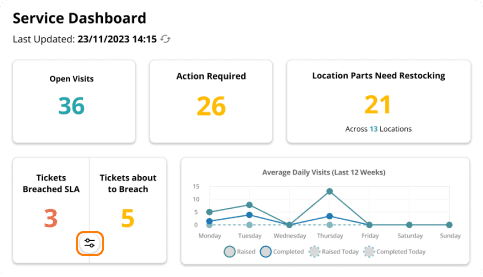
Open Visits Widget
The Open Visits widget on the Service Dashboard displays the number of visits that are either accepted or allocated for the current date. This widget provides a quick overview of the day's active visits, helping you manage and track service activities effectively.
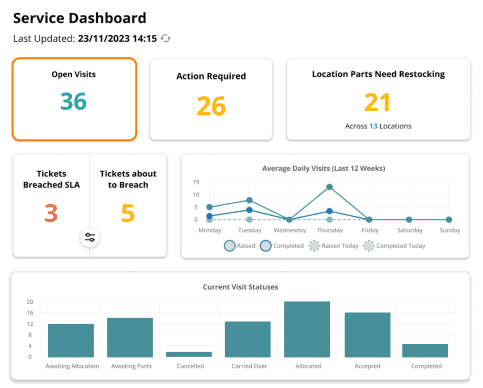
Selecting the Open Visits widget will navigate you to the Route List. In the Route List, the filter will automatically apply to the group you were viewing on the Service Dashboard, allowing you to see and manage the visits specific to that group.
Action Required Widget
The Action Required widget displays the number of visits that need attention. This includes visits that are pending reassignment, awaiting parts, or other actions as defined by your system’s criteria.
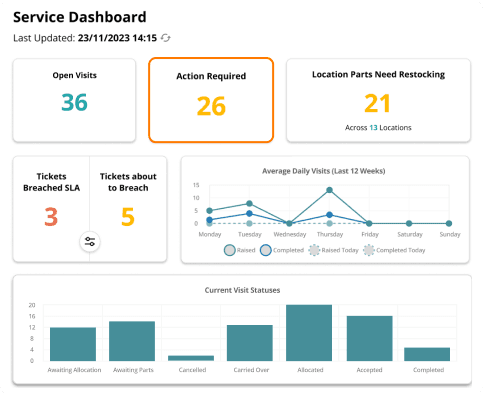
Selecting the Action Required widget will direct you to the Action Required screen, with the filter applied to show visits with statuses of "Awaiting Allocation" and "Awaiting Parts." This helps you quickly address the visits needing immediate attention.
Location Parts Requiring Restock Widget
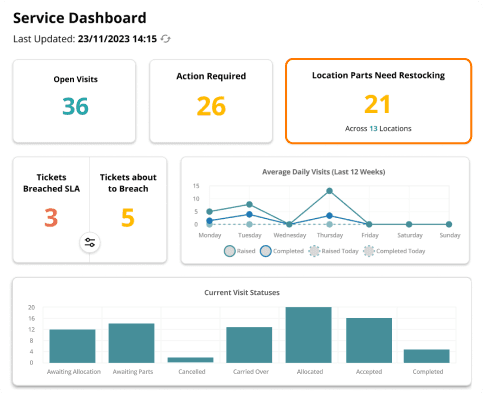
The Location Parts Need Restocking widget displays the count of parts that need restocking across various locations. This helps you identify and manage inventory shortages efficiently.
By selecting the Location Parts Need Restocking widget, you'll be taken to a detailed view where you can:
View Location Details:
Location Reference: The identifier for the location.
Description: A brief description of the location.
Location Status: The current status of the location.
View Parts Details:
Part Reference: The identifier for the part.
Part Name: The name of the part.
Stock Information:
Current Stock Level: The amount of stock available in the location, displayed in cases and singles.
Minimum and Maximum Stock Levels: The recommended stock levels, in cases, to maintain optimal inventory.
Reorder Quantity: The amount needed to bring the stock up to the maximum level.
This view helps you manage inventory by providing essential information on parts that need restocking.

Breach / About to Breach Widget
The Breached / About to Breach widget provides an overview of ticket statuses based on their breach status:
Breached Tickets: Shown in red, these are tickets that have exceeded their SLA and are overdue.
About to Breach Tickets: Shown in orange, these tickets are approaching their SLA deadline and are at risk of breaching soon.
Selecting either the breached or about-to-breach sections of the widget will direct you to the Ticket List. In the Ticket List, you can:
View Details: See the specifics of each ticket that has breached or is close to breaching.
Take Action: Prioritise and address these tickets to prevent further issues and maintain service standards.
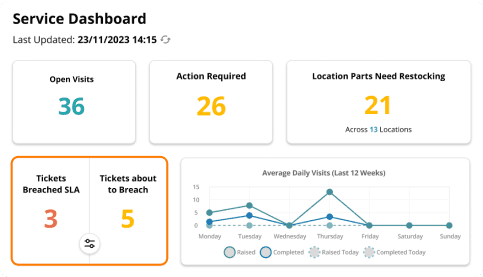
The number of tickets displayed in the Breached / About to Breach widget is influenced by the 'SLA Breach Warning' settings. These settings determine the thresholds for when tickets are categorised as "about to breach" or "breached."
To access and adjust these settings:
Navigate to Manage Account:
Go to the Manage Account section in SmartVend.
Access SLA Breach Warning Settings:
Locate the SLA Breach Warning settings within the Manage Account section.
Adjust Thresholds:
Modify the settings to define the warning thresholds for SLA breaches, affecting how tickets are categorised and displayed in the widget.
Super Users, Owners, and Internal Users have the permissions to view and modify these settings. Selecting the widget filter icon will also provide a direct link to these settings for convenience.
Average Daily Visits Widget
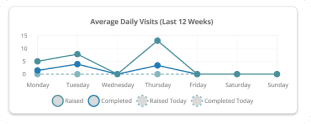
The Average Daily Visits widget shows the status of visits that have been raised within the last 12 weeks.
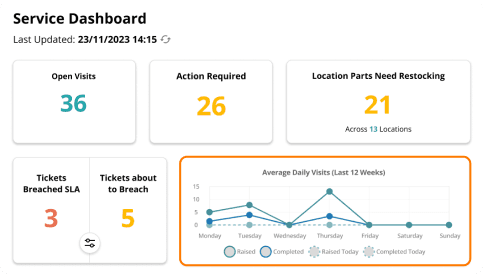
In the Average Daily Visits widget, you have the flexibility to filter the information to view what's most relevant:
Selectable Options: Each status category in the widget is selectable. This allows you to filter out specific types of visits or statuses.
Removing Filters: If you no longer wish to view certain categories, you can select the corresponding option, and it will be removed from the graph. When a filter is removed, it will appear with a strike-through to indicate it is no longer displayed.
Custom View: This allows you to tailor the information presented on the widget to focus on the data most important to your analysis.
This customisation feature makes it easier to focus on key metrics, especially during high-volume periods or when specific trends need closer monitoring.
Current Visit Statuses Widget
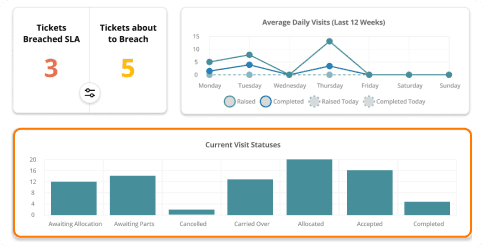
The Current Visit Statuses widget provides an overview of the status of visits scheduled for the current day. It breaks down the visits into different status categories, allowing you to quickly see how many visits are in each stage of the workflow, such as Accepted, Allocated, Completed, etc.
This widget offers a real-time snapshot of how visits are progressing, helping users manage and track the status of today's tasks efficiently.
In the Current Visit Statuses widget, you can interact with the bars on the graph to access more detailed information about specific visit statuses:
Selecting Bars: When you select a bar on the graph, it will take you to a page that displays the visits corresponding to the status you selected.
Awaiting Allocation or Awaiting Parts: Selecting these options will redirect you to the Action Required page, where you can manage and resolve visits needing parts or allocation.
Cancelled, Carried Over, Allocated, Accepted, or Completed: Selecting any of these will take you to the Route List page. The list will be automatically filtered by the status you've selected, and the date picker will default to the current date, ensuring you see the relevant visits for that day.
This interactive feature helps streamline navigation, making it easy to access specific visit statuses directly from the widget.
Quick Tip
Visits with a Service Fill Ticket Type will carry over to the assigned operator's schedule and will not move to the Action Required list. These visits will remain on the operator's route, updating to the current day until they are either completed or reassigned.
Map View
This map offers a visual representation of machine locations. When you first load the page, the map will zoom into a localised area where your machines are concentrated. For instance, if your machines are primarily situated in the South West of the U.K., the map will initially display this region rather than the entire U.K.
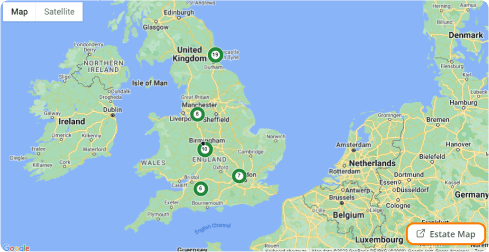
In the bottom right of the map view, you can select the "Estate Map" button, which will take you to the Estate Map.
Operator / Engineer Performance Table
The Operator / Engineer Performance Table provides a detailed list showing the performance of operators and engineers throughout the day. For an operator to appear in this list, they must have completed at least one visit. This table allows you to monitor productivity and assess how effectively visits are being managed and completed by each individual.
Mobile users with their Performance dropdown set to "Service" or "Both" will appear in the Operator / Engineer Performance Table. This table only displays the top 10 operators by default. If you wish to see the full list of operators, you can select "Overview."
The place in the table is determined by the % Completed column, with the operator having the highest percentage listed first. If two operators have the same completion percentage, the one with the higher number of completed visits is ranked higher.
You can view:
Open Visits and Completed Visits numbers for each operator.
The overall % of the operator's route that has been completed.
Breached Duration, indicating how many visits exceeded the expected time.
If you have a Planning license, each operator’s name is hyperlinked. Selecting a name will open their route list in a new tab, filtered to show their route for the day.
If you hold both a Stock and Service license, you can toggle between Stock and Service performance views.
When the toggle is set to Stock, the table will display operators whose performance is set to Stock or Both.
When the toggle is set to Service, it will display operators whose performance is set to Service or Both.
This allows you to filter and view performance data specific to stock or service tasks, depending on your focus.
Machine Profitability Widget
The Machine Profitability table displays the top 10 most profitable machines at a summary level. In this table, you can view:
Place: Ranking of the machine by profitability.
You can select the arrow in the Place column to sort and view the bottom 10 machines.
Machine Reference: The unique identifier for the machine.
Machine Name: The name assigned to the machine.
This table helps you quickly identify both the most and least profitable machines in your estate.

In the Machine Profitability table, alongside the machine's ranking, reference, and name, you will also see:
Net Profit: This column displays the total profit earned by each machine after accounting for all costs.
Net Profit Margin: This represents the percentage of profit made from the machine relative to its total revenue.
These metrics help you assess the financial performance of each machine, allowing for more informed decisions about resource allocation and machine management.

By selecting the Overview button in the Machine Profitability table, you can view detailed information about machine performance. The default data displayed covers the past 12 weeks, but you have the option to adjust the date range to see more or less information, depending on your needs.
This view offers a deeper insight into profitability trends and enables a more detailed analysis of each machine's financial performance over time.

In the detailed breakdown for each machine, the following columns provide insight into profitability:
Total Vends: Number of vends processed by the machine.
Product Cost: The total cost price of products vended, calculated as the average cost price multiplied by the total vends.
Products Sold: Total revenue from vends, calculated as the planogram price multiplied by the total vends.
Profit: The difference between Products Sold and Product Cost, indicating the machine's gross profit.
Profit Margin: The percentage of profit relative to Products Sold, calculated as (Profit / Products Sold) * 100.
Maintenance Costs: Total costs for maintenance, including visit costs (internal, external or custom), resolution code costs, and the cost of any parts installed, calculated as Cost of Visits + Cost of Resolution Codes + Cost Price of Parts Installed
Net Profit: The machine’s profit after subtracting Maintenance Costs from the Profit.
Net Profit Margin: The percentage of Net Profit relative to Products Sold, calculated as (Net Profit / Products Sold) * 100.
These metrics provide a comprehensive view of each machine's profitability, helping to identify which machines are performing well and which may require attention.
Contact
Hospitality
T: +44 (0)1642 358779
E: datamanagement@vianetplc.com
SmartVend
T: +44 (0)1642 358720
E: help@vianetplc.com
SmartInsight
T: +44 (0)1642 867940
E: advancedreportingteam@vianetplc.com
© Vianet Group PLC. Incorporated in England, being it's main place of operation.
Registered in the UK, Company No. 5345684


