Dashboard

What is the Dashboard?
The dashboard provides a comprehensive overview of the entire estate, offering insights into performance metrics across all machines. It serves as a centralised hub for tracking key data, helping to monitor and evaluate how the entire system is performing at a glance.
Permissions
This area does not require a license to access.
Users, Super Users, Owners, and Internal Users can view the information within this area.
Filters on the Dashboard
On the dashboard, you can adjust the date range, which will update the sales and product graphs, and will not affect the widgets. After selecting the From and To dates, click Apply to refresh the data.

If you're assigned multiple groups, you can select a specific group to view, which will update the graphs and widgets accordingly.
Sales and Vends Overview
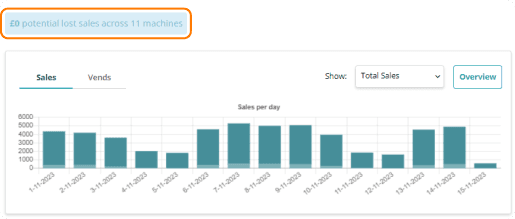
Potential lost sales can be identified via the blue banner above the Sales Per Day table. This is calculated based on the machine's rate of sale over the past 90 days for machines that haven't submitted sales data or have been powered off.
Benefit: Highlighting potential lost sales enables quick action to resolve issues and minimise revenue loss.
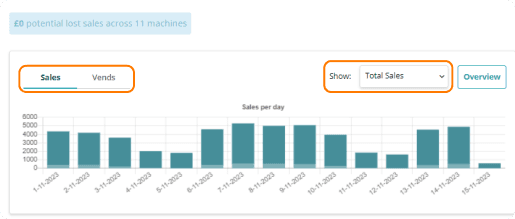
The Sales Per Day graph shows the total number of sales or vends over the last 14 days by default. You can switch between Sales and Vends using the toggle at the top of the table.
The Sales Per Day table displays "Total Sales" by default, but you can switch between "Total Sales" and "Cashless" via the Show dropdown.
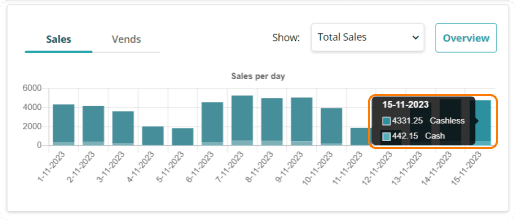
Hover over the bars to see a breakdown of Cashless or Cash sales/vends, depending on the selected view.
Quick Tip
You can adjust the number of days the overview table displays sales for.
This option is located in Manage Account → System Configuration → Dashboard Settings → "The default number of days to display sales on the dashboard"
Product Percentage Breakdown
The Product % Breakdown and Product Category % Breakdown graphs show products sold as a percentage of total sales.
Hover over the bars to see the exact percentage breakdown for each graph.
Overview Drilldown
Each graph— Sales Per Day, Product % Breakdown, and Product Category % Breakdown — features an Overview button that directs you to the Dashboard Overview.
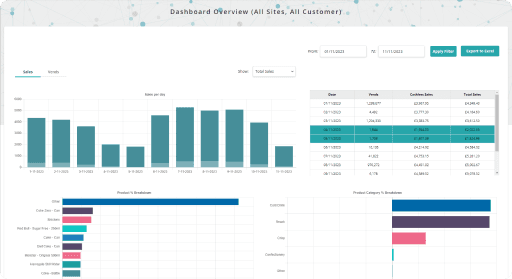
The graphs on the Dashboard Overview display the same information as on the main dashboard, with an additional table on the right-hand side. This table provides a day-by-day breakdown of vends, cashless sales, and total sales.
Weekend dates within the table are highlighted with a teal bar.
Benefit: The day-by-day breakdown and weekend highlights offer detailed insights and help track sales trends more effectively.
Widgets
Dashboard widgets can be configured to display only when a machine exceeds a specific threshold. This setting is located in Manage Account → System Configuration → Dashboard Settings → "Severity of machine threshold of when to appear on the Dashboard".
Adjusting the dashboard severity helps you focus on significant breaches, allowing you to view and prioritise issues effectively.
Each widget shows the number of machines reporting issues in that specific area. The 'Machines in Issue' widget displays the total number of machines with issues. Within other widgets, a machine appears only once, following a hierarchy: No Sales, No Comms, No Audit Read, No Sales.
For example, if three machines are shown in the 'Machines in Issue' widget, each might appear in the 'No Sales,' 'No Audit Read,' and 'No Comms' widgets respectively.
A machine may also appear in the Technical Fault and Hygiene widgets alongside other widgets.
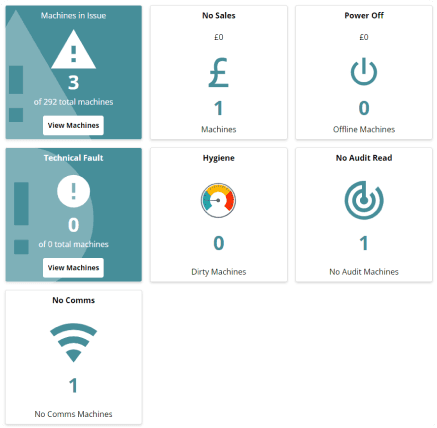
Hovering over a widget reveals a description of the widget and the criteria for a machine to appear on the list. Selecting a widget opens a table view showing all machines that have breached the threshold parameters for that widget.
In this view, you can see each Site Name, Machine Reference, and Machine Name. The machine name is hyperlinked, directing you to the machine’s information page. If an icon is red, it indicates an issue with the machine. Hovering over the icon displays a description of the problem.

The Lost Sales column indicates the potential revenue loss the machine has experienced due to the recorded issues.
Quick Tip
Power Off
Occurs when a machine has submitted a power-off event and has been offline for a period exceeding the configured threshold. This threshold is set in Manage Account → System Configuration → Dashboard Settings → "Number of hours a machine is powered off before it is considered a problem"
No Comms
Occurs when a machine has failed to communicate with the system for a period longer than the defined threshold.
Related Machine Threshold: No Comms
No Audit Read
Occurs when a machine has not submitted an audit file to the system for a period exceeding the defined threshold.
Related Machine Threshold: No Audit Read
No Sales
Occurs when a machine has not submitted any sales data for a period beyond the defined threshold
Related Machine Threshold: No Trading
Technical Fault
Occurs when a machine has submitted a ticket that remains unresolved. To include Machine Alarms in Technical Faults, enable this in Manage Account → Ticket Dashboard Settings → “Dashboard Technical Faults Include Machine Alarms”
No Restock
Occurs when a machine has not been restocked for a period exceeding the defined threshold.
Related Machine Threshold: Last Visit
Cleanliness
Occurs when a machine has not reported a hygiene event for a period exceeding the defined threshold.
Related Machine Threshold: Last Clean
Benefit: Clear definitions and thresholds for each issue type help streamline problem identification and resolution, improving machine management and operational efficiency.
Products Requiring Restock
To view this widget, you need to have a Stock licence assigned to you.
You can enable or disable this licence in Manage Account → System Configuration → Dashboard Settings.
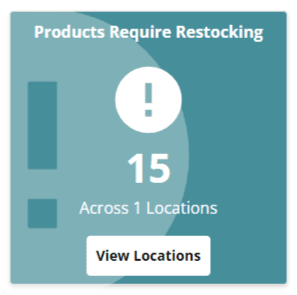
If a Stock Location has a Minimum Stock Level set for each product, any product falling below this level will appear on the widget. This helps identify products that need restocking and alerts organisations when they need to place additional orders.
The top number indicates the total number of products requiring attention, while the widget also shows how many locations have products below their minimum stock level.
Benefit: Monitoring stock levels in real-time helps ensure timely restocking and prevents shortages, improving inventory management and operational efficiency.

Selecting this widget opens a table view of all products that have fallen below their minimum stock level.
In this view, you can see each Location Reference, Description, and Status. The table also displays the Product SKU and Name for each listed product.
The Current Stock Level shows the stock available at that location, both in cases and singles. The Minimum and Maximum Stock Levels indicate the recommended stock levels in cases, and the Reorder Quantity shows how much is needed to bring the product up to the Maximum Stock Level.
Selecting this widget will take you into a tabled view of all of the products that have fallen below their minimum stock level.
Today’s Completed Routes
To view this widget, you need to have a Stock licence assigned to you.
You can enable or disable this licence in Manage Account → System Configuration → Dashboard Settings.
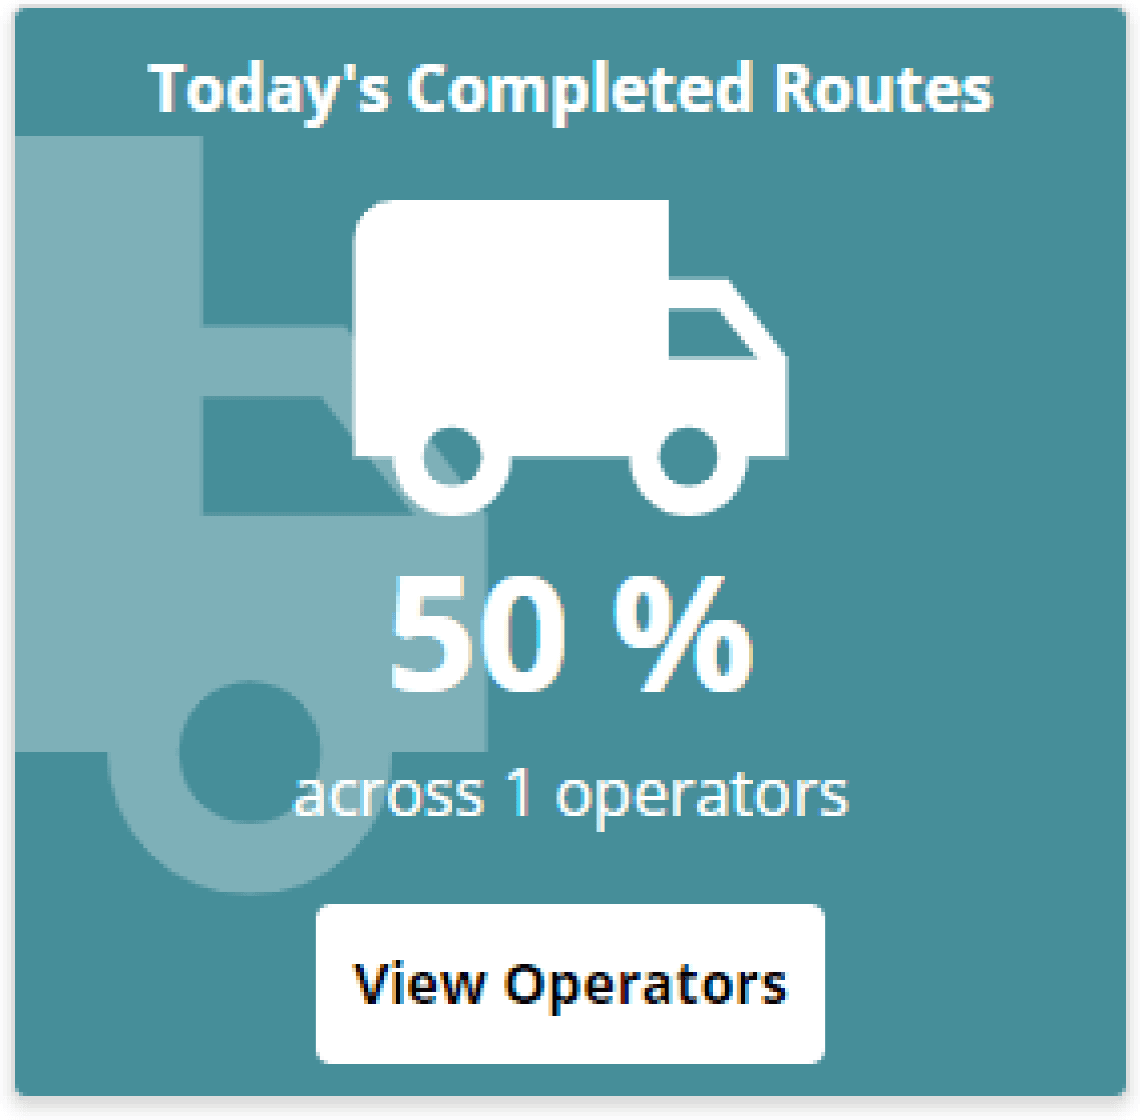
Mobile users with their Performance dropdown set to 'Stock' or 'Both' will appear in this widget. It shows the number of mobile users and the overall percentage of tasks completed for the current day.
If no visits have been completed, the widget will not display any information.
Benefit: This widget helps track the progress of mobile users in real-time, improving task management and performance monitoring.
Selecting "View Operators" takes you to the Performance table, displaying all operators contributing to the widget's results.
Operators are ranked by the % Completed column, with the highest percentage listed first. If two operators have the same completion percentage, ranking is then determined by the number of completed visits.
The table shows the number of Open and Completed visits, along with the overall percentage of the operator’s route that has been completed. The final column, Breached Duration, indicates how many visits exceeded the expected time.
If you have a planning licence assigned, each operator’s name will be hyperlinked. Clicking the name will open the route list for that operator in a new tab, displaying their route.
Benefit: This feature allows for efficient operator performance tracking and in-depth route analysis, enabling better planning and time management.
If you have both a Stock and Service licence, you can toggle between Stock and Service.
When set to "Stock," operators with their performance set to "Stock" or "Both" will appear. When switched to "Service," operators with their performance set to "Service" or "Both" will be shown.
